Pivot table: summarize sales by region and product
A pivot table turns hundreds of rows into a short report: regions down the side, products across the top, revenue in the cells and grand totals at the edges. Drop fields into the areas and the editor does the summing, counting and averaging for you.
- Live formulas in the report
- Recommended pivot tables
- Free
- No sign-up
How to create a pivot table
“Sales pivot table” example
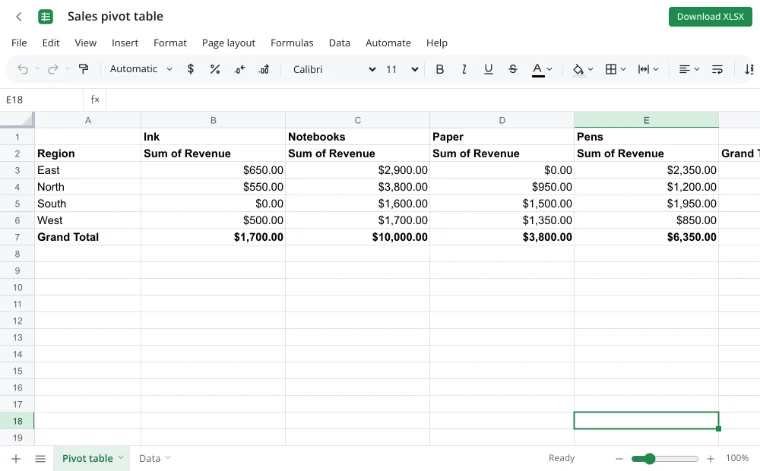
The first sheet opens with a finished report: regions in rows, products in columns, revenue in the cells and grand totals along the edges. That is the result you will build from the data sheet.
“Data” sheet
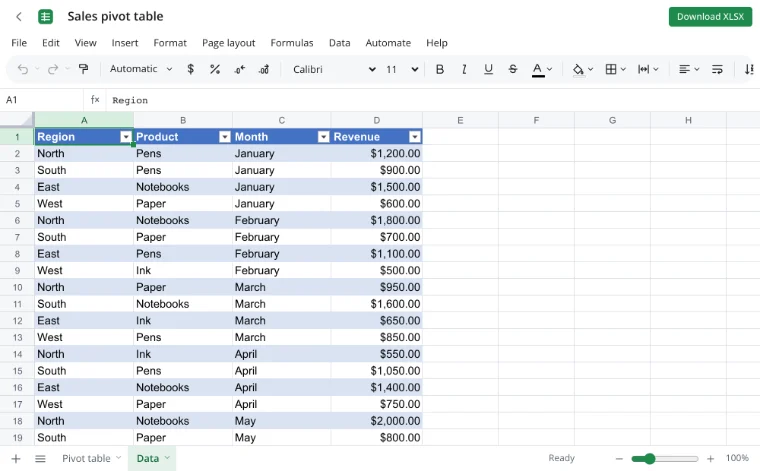
The second sheet holds 20 sales rows: region, product, month and revenue. The header row supplies the field names, and the report is built from them. New rows join the calculation after a refresh.
“Edit pivot table”
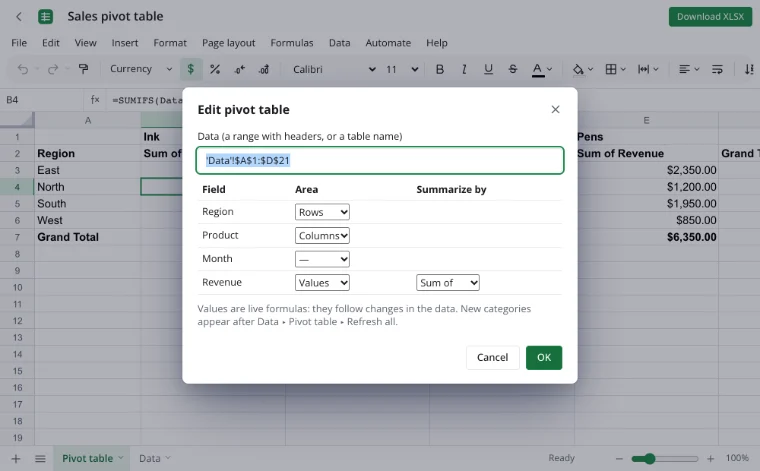
In the “Edit pivot table” dialog, drag fields into Rows, Columns, Values and Filter. For Values choose a function: Sum, Count, Average, Max or Min.
“Refresh all”
After the data changes, click “Refresh all” and new categories appear in the report. When the source is a smart table, the report follows the table as it grows.
Use cases
- Sales by rep and month: one report for a weekly review.
- Expenses by category: see where the budget went.
- E-commerce orders by product and country.
- Payroll totals by department.
- School grades by class and subject.
How do I create a pivot table?
Select a cell in a range with headers and open “Data ▸ Pivot table ▸ Create pivot table…”. Choose the range or a table name as the source; the region around the selection is suggested. The report is placed on a new sheet.
Move a field to Rows, another to Columns and a number field to Values, then pick Sum, Count, Average, Max or Min. Put a field in Filter to add a dropdown cell that starts at “(All)”. Grand totals appear by rows and by columns.
How do I create a pivot table in Excel?
The steps match Excel: select the data, open the pivot table command, place fields in the four areas and choose a summary function. Zotu is not affiliated with Microsoft, but it opens and saves Excel workbooks. One difference to know: a native pivot table inside an opened XLSX keeps its numbers but is not an interactive report here — rebuild it from the data sheet.
How do I update a pivot table?
Click “Refresh all” after the source data changes. New categories are added and the numbers are recalculated, because the report values are live formulas such as SUMIFS and COUNTIFS rather than a snapshot. A smart table source expands with the table.
How do I count rows in a pivot table?
Put a field in Values and choose Count. The available summary functions are Sum, Count, Average, Max and Min, so the report counts entries in each group. “Recommended pivot tables…” proposes ready reports — sums of each number column by category, counts, and a two-field breakdown — with a preview.
Where does each field go?
The four areas answer four different questions. If a report looks wrong, check which area the field landed in before changing the data.
| Area | What it does | Example |
|---|---|---|
| Rows | One line per group, nested if you add a second field | Region, then sales rep |
| Columns | Splits the numbers across the top | Product or month |
| Values | The numbers themselves, with a summary function | Sum of revenue |
| Filter | A dropdown that shows one group at a time | One country or year |
Recommended pivot tables
“Recommended pivot tables…” reads the headers and offers ready reports: a sum of each number column by category, a count by category, and a two-field breakdown with one field in rows and one in columns. Each suggestion comes with a preview, so you can see the shape of the report before it is placed on a new sheet. It is the quickest way to start when the data is new to you; you can still move fields afterwards in “Edit pivot table”.
Report filter and grand totals
A field in Filter becomes a dropdown cell above the report that starts at “(All)”. Choose one region, one month or one sales rep and the values are recalculated for that group only; the grand totals follow the filter. Grand totals are shown by rows and by columns, so the last row and the last column of the report answer “how much in total” without a separate formula.
Pivot table from several tables
One report has one source: a range or a smart table. To summarize several exports, first put them on one sheet with the same columns in the same order and a single header row, then build the report over the combined range. Every field is then shared by all the rows, and new rows are picked up by “Refresh all”.
Features
| Feature | What it gives you |
|---|---|
| Source | A range with headers or a smart table name. |
| Areas | Rows, Columns, Values and Filter. |
| Functions | Sum, Count, Average, Max and Min. |
| Placement | The report goes to a new sheet. |
| Live values | SUMIFS and COUNTIFS follow the data as it changes. |
| Refresh all | Adds new categories after an update. |
| Recommended pivot tables | Ready reports with a preview. |
| Report filter | A dropdown cell starting at “(All)”. |
| Grand totals | By rows and by columns. |
| GETPIVOTDATA | Reads a single value from the report. |
| GROUPBY and PIVOTBY | Build a summary with one formula. |
Limits
- Native Excel pivot tables in an opened XLSX keep their numbers but are not interactive here.
- Slicers and timelines are not available.
- The data model (Power Pivot) is not available.
- Real-time co-editing is not available.
- On the tool page a file is limited to 100 MB.
Privacy
The workbook is opened and calculated in your browser, so sales exports and payroll files stay on your device. A file reaches a server only through “Save to cloud”, and cloud files are stored in the EU/US under GDPR. A finished report can be saved as a PDF.
Frequently asked questions
Support: [email protected]
How to pivot table?
Select a cell in data with headers and open “Data ▸ Pivot table ▸ Create pivot table…”. Choose the range or table, then drag fields into Rows, Columns, Values and Filter. Pick Sum, Count, Average, Max or Min for the values. The report opens on a new sheet and updates with “Refresh all”.
How to pivot table Excel?
The workflow is the same as in Excel: select the data, insert a pivot table, place fields in the four areas and choose a function. Zotu is not affiliated with Microsoft but reads and writes Excel files. Native pivot tables from an opened XLSX keep their values but are not interactive here.
How to create pivot table in Excel?
Click a cell inside the data, open the pivot table command, confirm the range and press OK. Then drag a category field to Rows, another to Columns and a number field to Values. Change the summary function in the Values area. Everything is built from the headers, so keep them in one row.
How to use pivot table Excel?
Use it to summarize a long list without writing formulas: one field groups the rows, another splits the columns, and Values sums or counts the numbers. Add a field to Filter to view one category at a time. “Refresh all” brings in new rows and categories.
How to create pivot table in Excel with multiple columns?
Put two fields in Rows to get nested groups, or one in Rows and one in Columns for a two-dimensional report. Several number fields can sit in Values at once. The example does exactly this: regions in rows, products in columns and revenue in the cells.
How to create pivot table year wise?
A column with a year becomes a field like any other: add a Year column to the data, then place it in Rows or Columns. For months, keep a Month column in the source. The report then splits sums by year and month, and the values stay live.
Is it free? Is there a watermark?
Yes, the tool is free: pivot tables, recommended reports and refresh work without payment, a trial period or a watermark. No account is needed to open a workbook, build a report and download the file. Signing in is only required for cloud storage.
Is it safe to upload documents?
Nothing is uploaded: the workbook is opened and calculated in your browser on your own device. Sales exports, expense lists and payroll files therefore stay with you. A file reaches a server only through “Save to cloud”, and is then stored in the EU/US under GDPR.
More tools
Excel formulas
Write sums, averages, conditions and percentages with autocomplete and argument hints.
VLOOKUP
Pull a price, rate or name from another table by code with a VLOOKUP formula.
XLSX viewer
Open an XLSX workbook in the browser and save your edits back to the file.
CSV to Excel
Turn a CSV export into an XLSX workbook with real columns, numbers and dates.
Excel to PDF
Turn a spreadsheet into a print-ready PDF with its layout, charts and headers.
Household budget template
A free household budget spreadsheet: income and expenses by category, plan versus actual, variances and totals calculated for you.
Invoice template
An invoice spreadsheet that does the math: line totals, subtotal, tax and grand total calculate automatically.
Loan calculator with amortization schedule
A loan calculator spreadsheet with a full amortization schedule: monthly payment, total interest and month-by-month balance.
Pivot table: summarize sales by region and product
Build a report with regions in rows, products in columns, sums and grand totals.
Open editor